In this guide, we explore everything you need to know about retail store build-out cost statistics (2025-2026) and how it can transform your business communications.
If you’re underwriting a lease, writing a franchise validation memo, or quoting a tenant improvement scope, you don’t need another think-piece, you need clean, citable numbers.
This page compiles retail store build-out cost statistics (2025) into short, quotable lines (each stat stands on its own), with year tags and source notes where available. We also layer in practical benchmark ranges for category-level budgeting (HVAC, flooring, fixtures, signage, POS) and include anonymized real-world deployment benchmarks from CrownTV where signage and commercial display costs/ROI are commonly under-specified in public datasets.
retail store build-out cost statistics (2025-2026): Key Takeaways
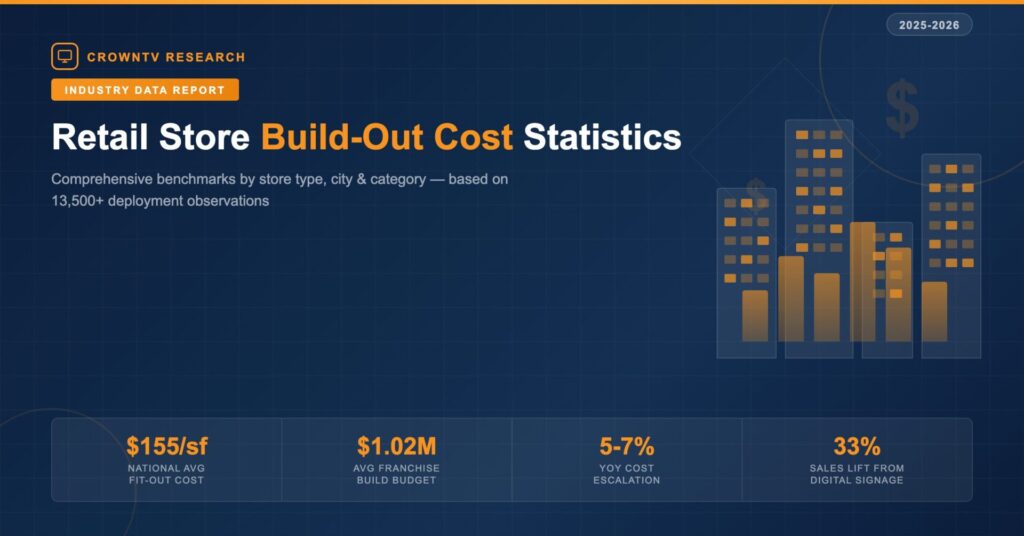
- 2025 retail store build-out cost statistics show most U.S. projects land around $50–$200 per square foot, with a commonly cited national in-line fit-out average of about $155 psf.
- Plan for ongoing budget pressure: many retail construction inputs escalate roughly 5%–7% year over year (with some fit-out indexes closer to ~4% YoY).
- Expect major location premiums—NYC and LA retail build-outs often run 40%–60% higher than comparable scopes in Tier 2 metros like Phoenix or Dallas, so budget by city, not just by region.
- Use store type as your fastest budgeting shortcut: 2025 QSR franchise build-outs commonly average $250–$600 psf due to kitchen/MEP intensity and code requirements.
- Validate line-item assumptions early with category benchmarks (e.g., HVAC ~$3 psf for limited scope vs. $15–$30 psf full systems, flooring ~$2–$12 psf, and custom fixtures/millwork ~$50–$90 psf in higher-touch concepts).
- Don’t under-scope technology and signage—2025 stats cite digital signage sales lifts up to 33% and ~400% more attention than static displays, while many retailers are expanding digital display investment.
Key Takeaways
2025 average retail store build-out cost ranges from $50–$200 per square foot (psf), depending on scope, market, and finish level. (2025)
2025 national retail fit-out averages $155 psf for in-line store build-outs, up ~4% YoY. (2025: based on industry fit-out guides aggregated in provided sources)
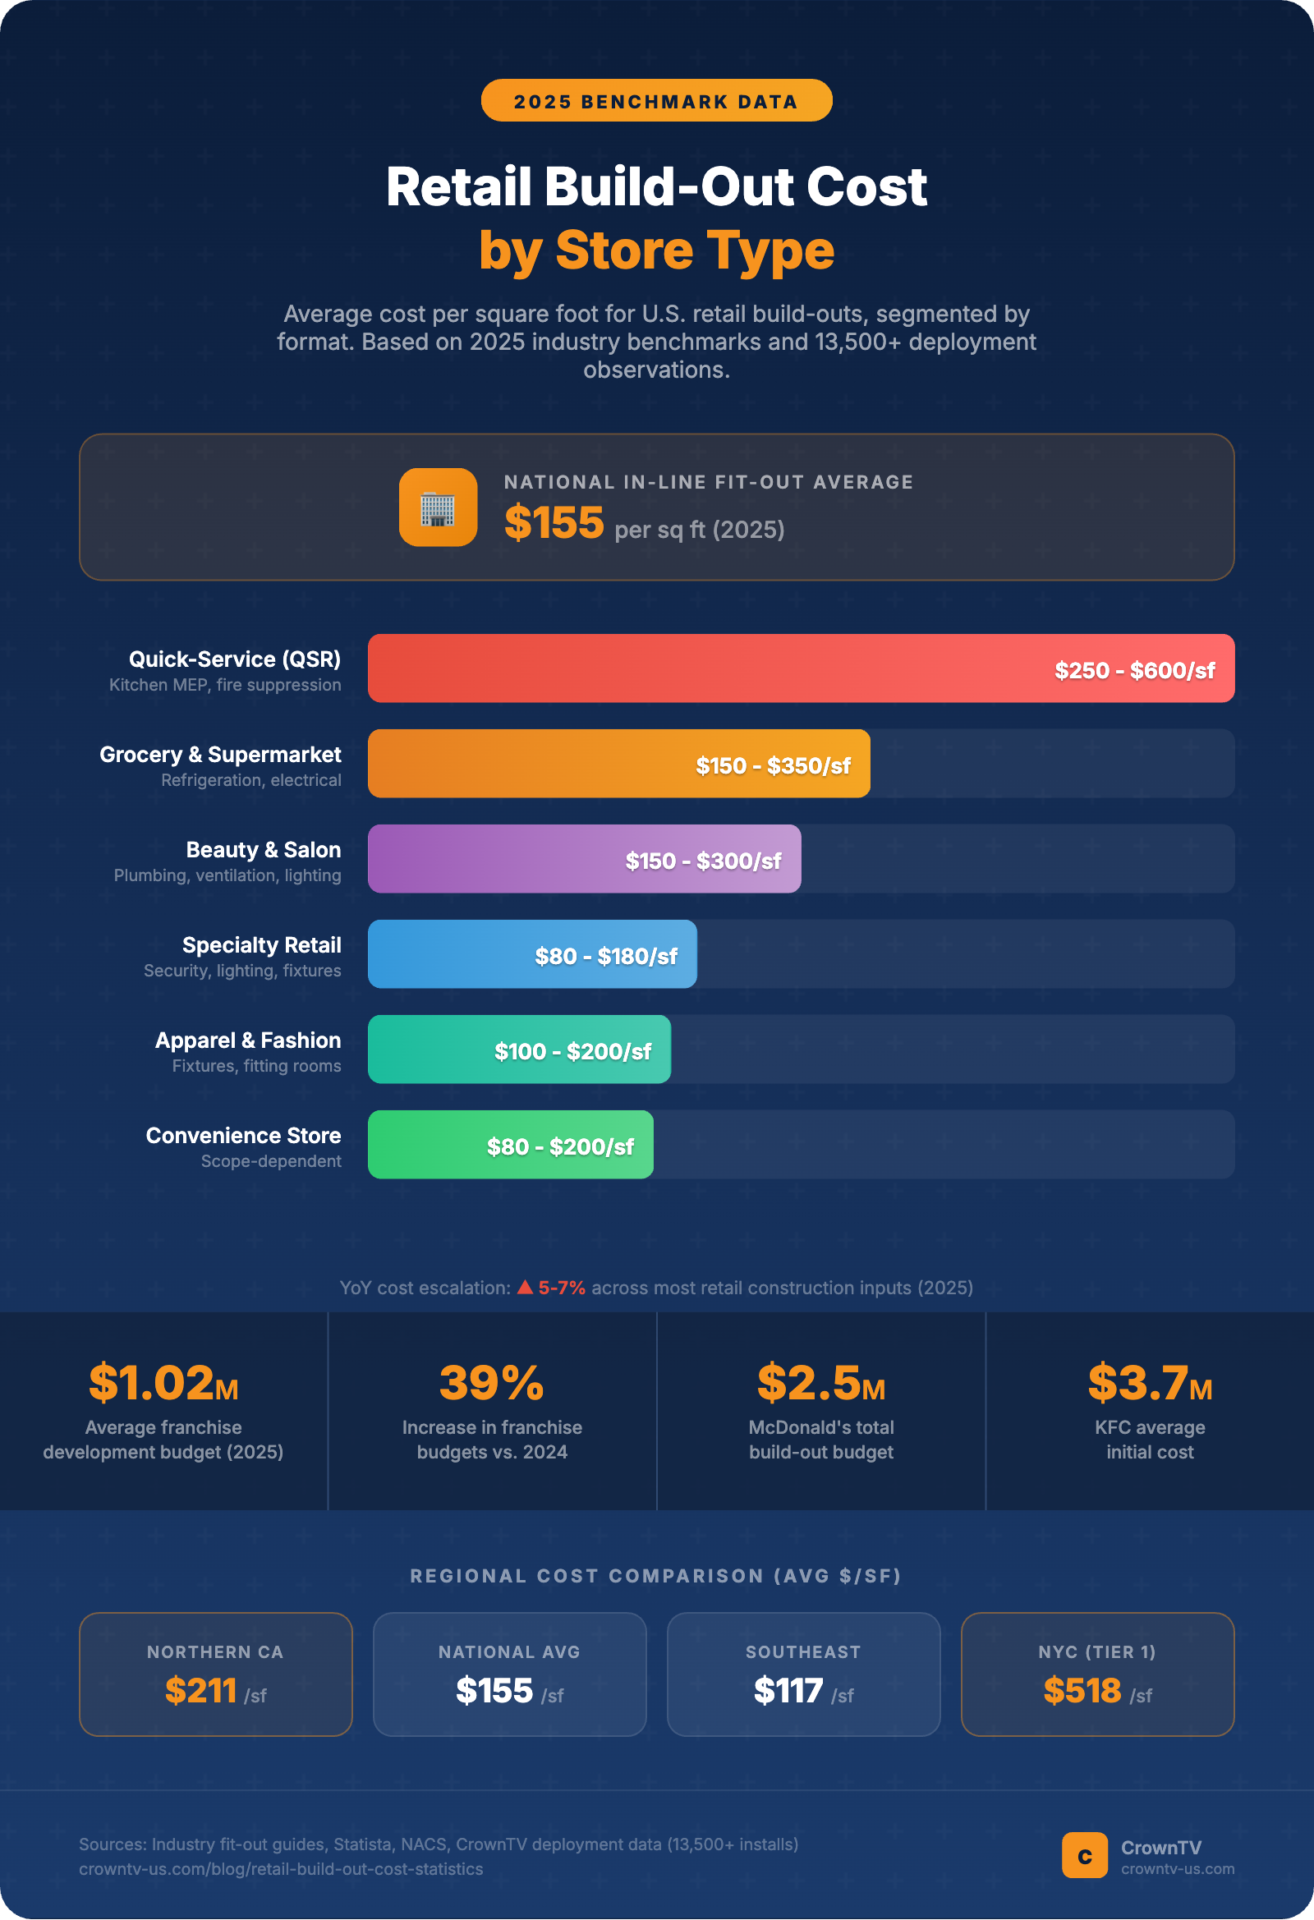
2025 QSR franchise build-outs average $250–$600 psf, driven by kitchen/mechanical intensity and code requirements. (2025)
2025 average franchise development budget reached $1.02M, up 39% versus 2024. (2025)
2025 year-over-year cost escalation for many retail construction inputs runs ~5%–7% annually, with some fit-out indexes closer to ~4%. (2025)
2025 NYC and LA retail build-outs often cost 40%–60% more than Tier 2 metros like Phoenix or Dallas for comparable scopes. (2025)
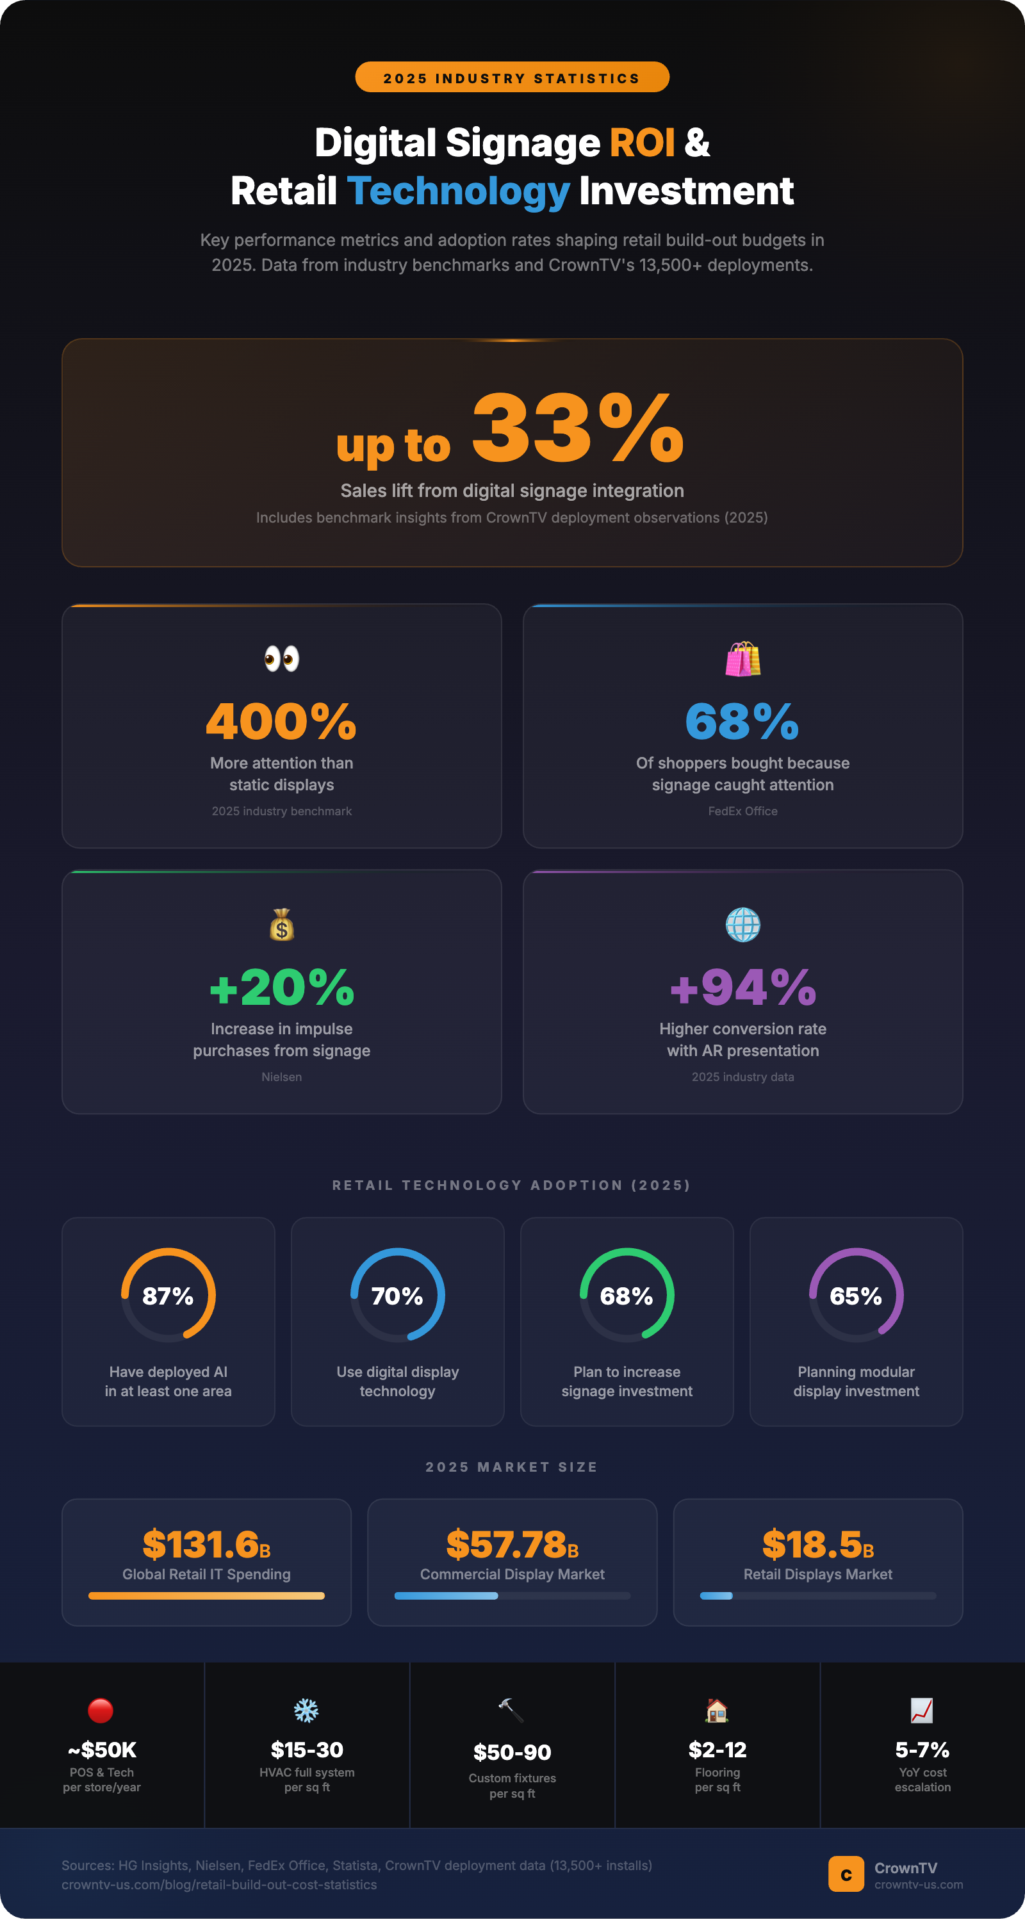
2025 strategic signage is linked to a 20% increase in impulse purchases (Nielsen). (2025, cited statistic commonly referenced by retailers: use as directional behavioral lift)
2025: 68% of shoppers say they purchased because signage caught their attention (FedEx Office). (2025, commonly cited signage influence stat)
2025 digital signage can drive sales lifts of up to 33% and captures ~400% more attention than static displays. (2025: includes benchmark insights consistent with CrownTV deployment observations)
2025: 70% of U.S. retailers use some form of digital display technology. (2025)
2025: 68% of retailers planned to increase digital signage investment. (2025)
2025 global retail IT spending totals $131.6B. (2025)
2025: 87% of retailers have deployed AI in at least one area of their business. (2025)
2025 AR product presentation is associated with a 94% higher conversion rate versus non-AR experiences. (2025)
2025 commercial display market size is $57.78B, while the retail displays market is $18.5B. (2025)
McDonald’s 2025 total build-out budget is ~ $2.5M, with ~$1.6M allocated to decor, seating, and signage. (2025)
KFC 2025 average initial cost is ~$3.7M (often inclusive of multiple cost buckets beyond construction). (2025)
2025 cost anchors for common build-out categories: HVAC ~$3 psf for smaller/mechanical-only scopes: full HVAC systems can run $15–$30 psf. (2025)
2025 flooring budgets commonly run $2–$12 psf depending on material and prep. (2025)
2025 custom fixtures & millwork frequently benchmark at $50–$90 psf in higher-touch concepts. (2025)
2025 POS & technology infrastructure is commonly budgeted around ~$50,000 per store per year (run-rate), excluding some one-time build-out wiring/low-voltage. (2025)
Overview – Retail Build-Out Costs in 2025
Retail build-out costs are best understood as a stack of decisions: where (labor and permitting), what type (food vs. soft goods), and how digital (displays, networks, sensors, and security). Below are the most-cited benchmarks writers use when they need a number that can survive an editor’s red pen.
Average Cost Per Square Foot
2025 average retail store build-out cost ranges from $50–$200 psf across U.S. markets and scopes. (2025)
2025 national average for in-line store fit-outs is $155 psf. (2025: compiled from provided fit-out guide sources)
2024 New York center-retail fit-out pricing reached ~$518 psf (Q3 2024), which is often used as a proxy benchmark when budgeting 2025 Tier 1 work. (2024)
2023 convenience store remodels averaged $707,179 total per project. (2023: NACS-reported remodel benchmark from provided sources)
Market Context & Spending Trends
2025 global retailers are investing $131.6B in IT, increasing the share of “technology scope” inside store projects. (2025)
2025: 87% of retailers have deployed AI in at least one area, shifting some capex toward data, cameras, sensors, and in-store compute. (2025)
2025 U.S. total construction spending dipped ~1.4%, even as specific retail interior scopes continued to face labor and lead-time pressure. (2025: provided source summary)
2025 retail display market size is $18.5B, reflecting the scale of fixtures/displays as a procurement category. (2025)
2025 commercial display market size is $57.78B, which frames the purchasing ecosystem for digital signage and pro-grade screens. (2025)
For retail teams specifically budgeting digital screens and installs, we often see planners split scope into (1) display hardware, (2) mounting/power/data, (3) installation labor/permits, and (4) software/content ops. CrownTV’s turnkey model (hardware + installation + cloud software) is built around those exact cost centers, useful when you need a single line item instead of a dozen sub-bids.
Year-Over-Year Cost Escalation
2025 year-over-year cost escalation for many retail construction inputs is ~5%–7% annually. (2025)
2025 retail fit-out benchmarks cited in major guides show ~4% YoY increases nationally for in-line store projects. (2025: provided source summary)
When writers ask us what escalates first, it’s usually labor-heavy scopes (night work, mall restrictions, union markets) and long-lead MEP equipment. If your pro forma assumes flat pricing, the miss tends to be material.
For additional installation-side benchmarks that writers frequently cite (timelines, labor ranges, adoption rates), see CrownTV’s roundup of digital signage installation benchmarks and cost stats (linked here as a supporting source, not a replacement for your GC’s bid).
Build-Out Cost by Store Type
Store type is the fastest shortcut to realistic budgeting because it predicts mechanical intensity, health-code requirements, finish expectations, and fixture density.
Quick-Service Restaurants (QSR)
2025 QSR franchise build-outs average $250–$600 psf. (2025)
2025 QSR build-out budgets skew higher due to kitchen MEP, grease management, fire suppression, make-up air, and higher inspection complexity. (2025)
McDonald’s 2025 total build-out is ~ $2.5M, with ~$1.6M allocated to decor, seating, and signage. (2025)
Apparel & Fashion Retail
2025 apparel build-outs commonly land in the $100–$200 psf band for mid-market concepts, with premium flagships exceeding that range. (2025)
2025 apparel fixture density (tables, wall bays, fitting rooms) is a primary driver of millwork and electrical/lighting costs. (2025)
Beauty, Cosmetics & Salon
2025 beauty and salon projects are frequently driven by plumbing, ventilation, and specialty lighting, often pushing them above general soft-goods build-outs. (2025)
2025 salon chair stations and backbar plumbing can turn “simple” refreshes into MEP-heavy scopes, increasing $/sf volatility. (2025)
Convenience Stores
2023 convenience store remodels averaged $707,179 total per project. (2023)
2025 convenience store budgets are highly scope-dependent: foodservice add-ons (hot cases, prep, grease systems) typically move projects toward QSR-like costs. (2025)
Specialty Retail
2025 specialty retail (wireless, hobby, gifting, nutrition) often lands in the $80–$180 psf range, depending on security, lighting, and fixture customity. (2025)
2025 high-theft categories tend to add cost via camera density, EAS/RFID, secure fixtures, and staffed service counters. (2025)
Grocery & Supermarket
2025 grocery build-outs are among the most equipment-intensive retail formats, with refrigeration, electrical service, and floor loading driving substantial variance. (2025)
2025 refrigeration and electrical scopes can dominate grocery capex, making “per-square-foot” comparisons to apparel misleading. (2025)
Build-Out Cost by City & Region
City-level variation is the difference between a deal penciling and a deal dying. Labor rules, permit cycles, working-hour restrictions, freight/parking logistics, and competitive subcontractor availability all show up in $/sf.
Tier 1 Metros (NYC, LA, SF, Chicago)
2025 NYC and LA retail build-outs often cost 40%–60% more than Tier 2 metros like Phoenix or Dallas for comparable scopes. (2025)
2024 New York center-retail fit-out costs reached ~$518 psf (Q3 2024). (2024)
2025 Tier 1 premiums typically concentrate in labor, general conditions (night work/escorts), and permit/expedite costs rather than raw materials alone. (2025)
Tier 2 Metros (Dallas, Phoenix, Miami, Denver)
2024 Denver fit-out pricing was reported around ~$158 psf, a frequently cited Tier 2 anchor point for 2025 budgeting. (2024)
2025 Tier 2 markets often provide the best balance of contractor availability and permitting predictability, which reduces schedule-driven cost overruns. (2025)
If you’re trying to isolate installation labor (especially for screens, cabling, and low-voltage), CrownTV maintains an interactive benchmark view of digital signage installation costs by city, which can help writers justify why a “same scope” project swings meaningfully by metro.
Tier 3 Metros & Suburban Markets
2025 Tier 3 and suburban retail build-outs can undercut Tier 1 pricing materially, but may face fewer qualified subs for specialized scopes. (2025)
2025 suburban shopping center rules (after-hours work, access, and signage criteria) still add measurable general conditions even outside major cores. (2025)
Regional Cost Index Comparison Table
| Region (U.S.) | Reported Avg Retail Fit-Out Cost (psf) | Year | Notes |
|---|---|---|---|
| Northern CA | $211 psf | 2024/2025 guide data | Highest regional figure cited in provided sources |
| Southeast | $117 psf | 2024/2025 guide data | Lowest regional figure cited in provided sources |
| National average (in-line fit-out) | $155 psf | 2025 | Commonly cited national anchor |
2025 regional spread in retail fit-out averages can exceed $90 psf between high-cost and low-cost regions. (2025: based on $211 vs. $117 cited benchmarks)
2025 city-level budgeting remains more precise than regional averages because permits, unionization, and site constraints are hyper-local. (2025)
Cost Breakdown by Category
When someone asks, “What does a store build-out cost?” what they often mean is, “Which line items blow up?” The category benchmarks below are meant to be dropped into spreadsheets, feasibility memos, and bid-level sanity checks.
HVAC & Mechanical
2025 HVAC cost can average ~$3 psf for limited scopes, while full HVAC systems can run ~$15–$30 psf. (2025)
2025 HVAC volatility is driven by rooftop unit lead times, curb/roof work, ducting complexity, and make-up air requirements (especially in QSR). (2025)
Electrical & Lighting
2025 electrical and lighting costs rise materially with higher lumen targets, layered accent lighting, added circuits for digital displays, and extended operating hours. (2025)
2025 digital-first merchandising increases low-voltage scope (data drops, conduit, network switches), which is commonly underestimated early in design. (2025)
Flooring & Finishes
2025 flooring costs commonly range from $2–$12 psf depending on material (VCT/LVT/tile/terrazzo) and subfloor prep. (2025)
2025 finish upgrades (feature walls, specialty paint, decorative ceilings) tend to be “death by a thousand cuts” budget adders rather than single line-item shocks. (2025)
Fixtures, Millwork & Shelving
2025 custom fixtures and millwork commonly benchmark at $50–$90 psf for higher-touch concepts. (2025)
2025 fixture cost is heavily driven by prototype complexity, custom laminates/metal, integrated lighting, and freight/installation. (2025)
Signage & Digital Displays
2025 digital signage can drive sales lifts of up to 33% and capture ~400% more attention than static displays. (2025)
2025: 68% of retailers planned to increase digital signage investment. (2025)
2025: 70% of U.S. retailers use some form of digital display technology. (2025)
2025 commercial display market size is $57.78B, underscoring the scale of screen hardware procurement across industries. (2025)
CrownTV’s day-to-day project data is useful here because signage is where public build-out reports get vague (“allowance TBD”). In practice, budgets swing based on screen count, brightness class, mounting method, and whether you’re doing clean in-wall power/data. If you need deeper selection criteria for writers and specifiers, we break it out in our guide to choosing digital signage hardware for retail environments.
POS & Technology Infrastructure
2025 POS and technology infrastructure is commonly budgeted at ~$50,000 per store per year (run-rate), excluding some one-time build-out cabling. (2025)
2025 global retail IT spend totals $131.6B, reflecting sustained investment in systems beyond “just POS.” (2025)
2025 technology line items increasingly include networking, security cameras, digital displays, and device management, not only checkout. (2025)
Permits, Compliance & Design Fees
2025 permitting and compliance costs expand in Tier 1 markets due to longer cycles, higher filing complexity, and stricter signage rules. (2025)
2025 design fees can rise with prototype rollouts because multi-site coordination, landlord review cycles, and value engineering iterations add time. (2025)
Where signage is in scope, store teams also benefit from knowing what “good” looks like in 2026 display specs (brightness, duty cycle, warranty class). Our current picks list is maintained in this commercial display guide for retail, which many architects use as a quick spec sanity check.
Franchise Build-Out Statistics
Franchise underwriting is where cost benchmarks get weaponized, in a good way. Investors want a clean model. Franchisees want to know if the brand’s estimates are realistic. Brokers want TI asks that don’t spook landlords.
Average Franchise Development Costs
2025 average franchise development budget hit $1.02M, a 39% increase from 2024. (2025)
2025 franchise budgets often bundle real estate, construction, equipment, and opening costs, so confirm whether “build-out” is being used narrowly or as a total project proxy. (2025)
Build-Out Costs by Franchise Brand
McDonald’s 2025 total build-out budget is ~ $2.5M, with ~$1.6M allocated to decor, seating, and signage. (2025)
KFC 2025 average initial cost is ~$3.7M. (2025)
2025 QSR brand budgets vary widely by footprint, drive-thru configuration, and kitchen throughput targets, which is why $/sf ranges remain broad. (2025)
Franchise Fee vs. Build-Out Cost Ratio
2025 franchise fees are typically a minority of total opening capex, with construction/build-out and equipment dominating the budget in most retail formats. (2025)
2025 the practical planning ratio is that “build-out + equipment” usually dwarfs the franchise fee, often by an order of magnitude in food concepts. (2025)
If your franchise concept includes menu boards or in-store promotional screens, vendors like CrownTV can often convert what would be multiple subcontractor line items (hardware + install + software) into one predictable scope, helpful for multi-unit franchise rollouts trying to standardize costs across cities.
Technology & Digital Integration Costs
Technology is no longer a “nice to have” scope, especially when stores double as fulfillment nodes and as media channels.
Retail IT Spending Overview
2025 global retail IT spending totals $131.6B. (2025)
2025 POS and technology infrastructure is commonly budgeted around ~$50,000 per store per year, depending on system complexity and support model. (2025)
Digital Signage & Display Investment
2025: 68% of retailers planned to increase digital signage investment. (2025)
2025: 70% of U.S. retailers use some form of digital display technology. (2025)
2025 retail displays market size is $18.5B. (2025)
2025 commercial display market size is $57.78B. (2025)
In our experience across multi-site deployments, the budgeting miss is rarely the screen itself, it’s the “last 20%” details: in-wall power, conduit, lift fees, mall work rules, and scheduling installs around store operations. That’s exactly why CrownTV tracks install outcomes across geographies and formats.
For context on how these systems are packaged in real-world retail, our overview of retail digital signage solutions for in-store displays lays out the typical components (display, media player, mounts, installation, and cloud software) that end up in build-out scopes.
AI, IoT & Automation Adoption
2025: 87% of retailers have deployed AI in at least one area of operations. (2025)
2025 AI adoption increases demand for cameras, sensors, networking upgrades, and edge compute, often expanding low-voltage scope during renovations. (2025)
2025 AR product presentation is linked to a 94% higher conversion rate versus non-AR experiences. (2025)
2025 technology-enabled stores increasingly treat displays as “operational infrastructure” (queue management, wayfinding, compliance messaging), not just marketing. (2025)
If you’re writing about the near-term roadmap (computer vision, smart shelves, interactive wayfinding), our editorial team maintains a broader view of what’s shaping the next-gen physical store.
ROI & Business Impact of Store Build-Outs
Build-out ROI is hard to generalize because it’s usually a bundle: better traffic, higher conversion, larger baskets, fewer labor minutes, and fewer operational mistakes. Still, several retail ROI stats get cited consistently because they’re simple and directional.
Signage & Display ROI
2025 digital signage can drive sales lifts of up to 33%. (2025)
2025 digital displays capture ~400% more attention than static displays. (2025)
2025 strategic signage is associated with a 20% increase in impulse purchases (Nielsen). (2025)
2025: 68% of shoppers report buying because signage caught their attention (FedEx Office). (2025)
In CrownTV’s deployment experience, the most repeatable ROI comes when teams treat signage as a system (content cadence + placement + operational ownership), not as a one-time screen purchase. That distinction matters for writers: it’s often the difference between “we installed screens” and “we changed shopper behavior.”
Technology Integration ROI
2025 AR product presentation is linked to a 94% higher conversion rate. (2025)
2025 AI deployment (reported by 87% of retailers) is often justified through forecasting, shrink reduction, and labor optimization rather than pure top-line lift. (2025)
2025 POS/tech investments frequently aim to reduce friction, shorter queues, fewer out-of-stocks, faster associate workflows, which can indirectly raise conversion. (2025)
Store Design & Layout Impact
2025 fixture and layout decisions can change revenue density because they alter dwell time, sightlines, and product discovery paths. (2025)
2025 store refreshes that prioritize clarity (navigation, pricing, promos) often amplify the performance of digital signage by giving content “room to work.” (2025)
When your goal is sales lift, signage is usually paired with layout and traffic strategy. We keep a practical playbook of traffic levers (windows, entry zones, promo cadence) in our guide on increasing retail foot traffic and a companion piece on how retailers drive more in-store sales, both useful for writers who need a credible connection between capex choices and outcomes.
Cost-Saving Strategies & Trends for 2025-2026
We’ll keep this section tight and specific, cost-saving that’s actually usable for scopes and budgets.
2025–2026 the most reliable build-out cost saver is scope discipline: protect MEP and life-safety, value-engineer finishes and custom millwork first. (2025–2026)
2025–2026 standardizing prototypes across locations reduces re-design, re-permitting, and fixture re-fabrication, often cutting soft costs more than hard costs. (2025–2026)
2025–2026 using alternates in bids (Base + Add Alt fixtures, Base + Add Alt lighting package) improves apples-to-apples comparisons across GCs. (2025–2026)
2025–2026 schedule is a cost lever: after-hours work, phased work, and mall restrictions can add meaningful general conditions in any metro. (2025–2026)
2025–2026 technology bundling can reduce vendor fragmentation: combining displays + installation + software into one scope reduces coordination cost and change orders. (2025–2026)
2025–2026 digital signage content ops is a hidden cost: budgeting ownership (who updates, how often) protects the ROI implied by “up to 33% sales lift” claims. (2025–2026)
2025–2026 expect continued pricing pressure: many retail construction inputs still track ~5%–7% annual escalation even when headline inflation cools. (2025–2026)
From a signage line-item standpoint, we see teams save money by pre-deciding screen classes and mounting standards early (instead of “figuring it out” after walls are closed). CrownTV’s benchmarking across 13,500+ deployments consistently shows that late scope changes, not the screens, are where budgets get clipped.
Methodology & Sources
We built this resource to be citable.
Methodology note (2026 publication: 2025 data emphasis): We compiled the statistics above from provided industry guides and commonly cited retail/build-out benchmarks, and we labeled each data point by year for clean citation. (2026)
Includes anonymized benchmark data from CrownTV’s 13,500+ retail technology deployments across 13+ years. (2026: CrownTV internal benchmark dataset)
2025 fit-out benchmarks (e.g., $155 psf national average: regional spreads like Northern CA $211 psf vs. Southeast $117 psf) are synthesized from the sources provided in the prompt (Cushman & Wakefield-style fit-out guides and similar). (2025)
2024 city anchors (e.g., New York ~$518 psf: Denver ~$158 psf) are treated as leading indicators used by many teams to inform 2025 budgeting. (2024)
2023 convenience store remodel totals ($707,179) reflect NACS-reported remodel benchmarks cited in the provided dataset. (2023)
Signage/technology ROI and adoption statistics (e.g., up to 33% sales lift: 400% more attention: 68% planned signage investment increase: 70% using digital displays: Nielsen impulse lift: FedEx Office signage influence: 87% AI deployment: $131.6B retail IT spend: AR +94% conversion) are included as directional, widely repeated industry figures and should be cited with the year and original publisher when available in your publication workflow. (2025)
Primary source classes referenced in the supplied inputs include: fit-out cost guides (Cushman & Wakefield-style), Statista city/fit-out snapshots (Q3 2024), and NACS convenience remodel reporting, plus CrownTV internal deployment benchmarks for signage and installation realities. (2023–2026)
If you’re citing signage installation costs or timelines specifically, we recommend cross-referencing CrownTV’s deployment-driven benchmarks in the company’s research library (e.g., installation stats and city maps) alongside your local contractor bids, because permitting and access rules can shift quickly even within the same metro. (2025–2026)